(Source from ProcessOn——web diagram tool for business process users)
Defining phase
1. Define the customer needs, analyze the system, looking for waste or variation, identify opportunities for improvement;
2. Analysis strategy and resource of organization;
3. Determine the project: Include key outputs of the projects, resources, project scope.
Measuring phase
4. Define the process characteristics;
5. Measuring process status(including time required for each procedure or action);
6. Measurement system analysis;
7. Evaluation process capability.
Analyzing phase
8. Analysis process, to find out the root cause or waste sources of variation;
9. Determine the process and key input factors.
Improving phase
10. Determine the relationship between Input and output variables,propose the optimization program;
11. Set improvement plans.
Controlling phase
12. Establish operational norms, implementation of process control;
13. Verify the measurement system, the process and its capacity;
14. Summarize the results of the implementation, specify successful experiences, raise some new question.
Tool selection
The implementing Lean Six Sigma projects should be based on a reasonable choice of lean manufacturing and Six Sigma tools, the principle of tool selecting is: choose the best tools according to the combination of resources, avoid wasting of resources.
Check the diagram:
2014年2月19日星期三

2014年2月12日星期三
Top 10 Tools to Create Diagrams and Infographics
Tools to create diagrams and wireframes
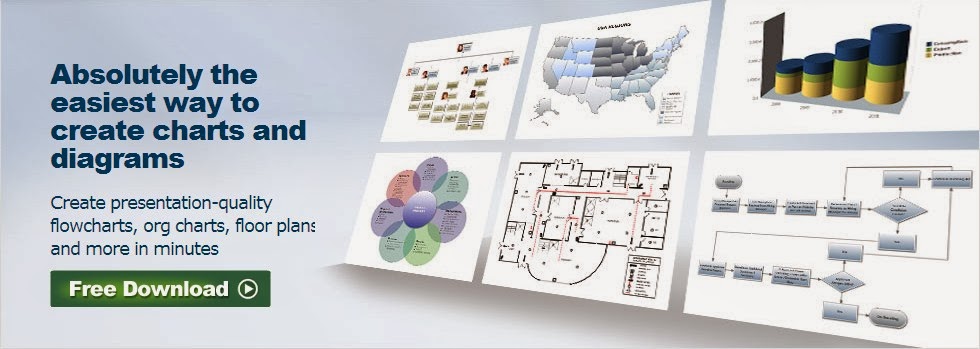
1.Smartdraw
This is a excellent visual processor,includes hundreds of professionally-designed templates for more than 70 types of visual. It automatically formats your visuals as you create them, making it possible for anyone to create professional-quality visuals of all kinds in minutes.
2.ProcessOn
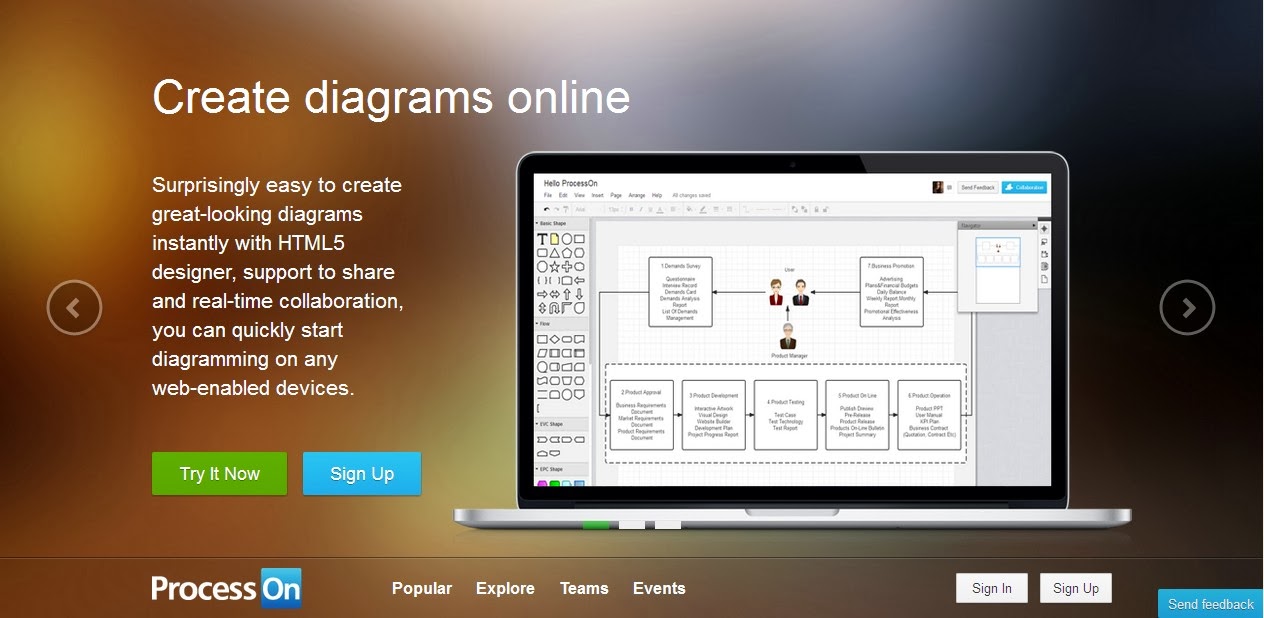
This is a very helpful web-based diagraming tool,massive diagram sources on it,it’s built based on HTML&Javascipt, allowing users to create on different systems and use different browsers without any incompatibility issues,all the service is free, sharing and real-time collaboration is one of the key features.Do not require any design basics to use it.
3.Cacoo
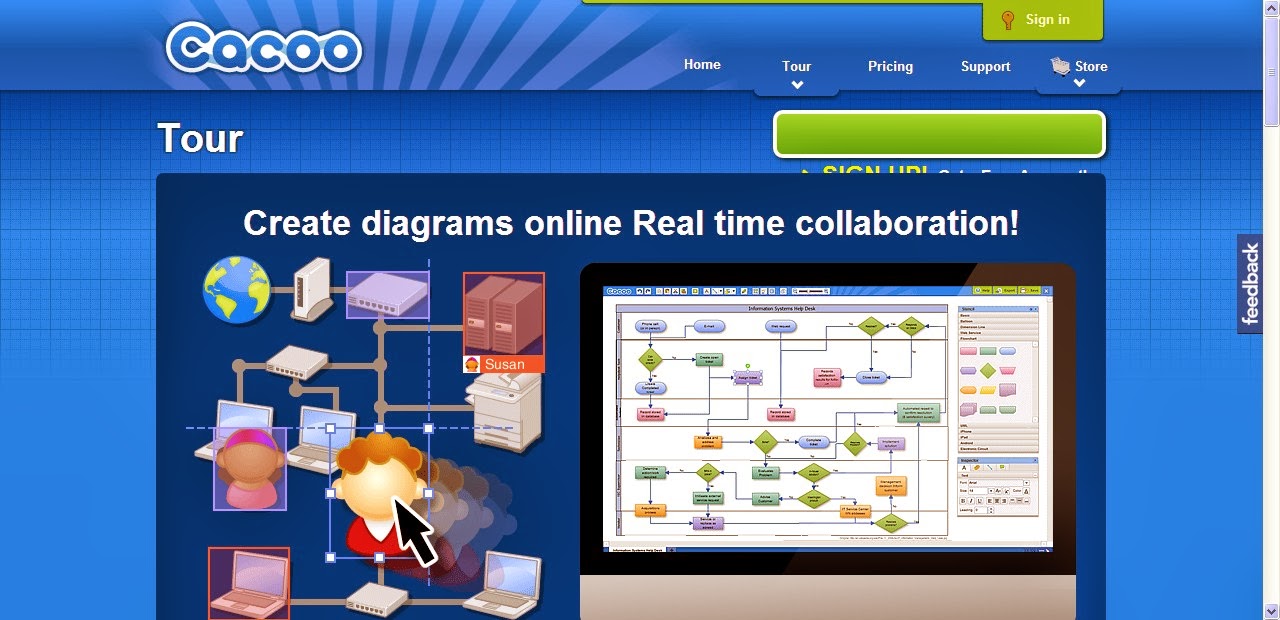
This is an online drawing tool for creating sitemaps, wireframes and network charts.It is useful for mapping and brainstorming ideas.Diagrams created using Cacoo can be linked-to directly from websites and web applications. When an update is made to the diagram, any linked images are also updated.
4.HotGloo
This is a interactive wireframing & prototyping tool,HotGloo makes it easy to wireframe web and mobile sites and to co-work with team members.The program has a user-friendly style and a high standard of interactivity.

5.OmniGraffle
This is an intuitive and easy to use Visual platform, it's quite an effective tool for wireframing in detail. You can customize and stylize objects to the extent that you can use the tool to create whole infographics exactly as you want them using this tool (it's difficult to do data visualizations with actual data, though). This tool has its cons, though; it's not the cheapest tool at $99 for standard and $199 for the pro version, and it's offered for Mac only.

6. Gliffy
This is an online diagram and flowchart program that can be used to create anything from network layouts and SWOT Analysis to Floor Plans and Wireframes. it is web-based, easy to accessible (though Flash is required). It offers a free trial of its Pro account for 30 days.

Tools to create infographics and data visualizations
7.Create.Visual.Ly
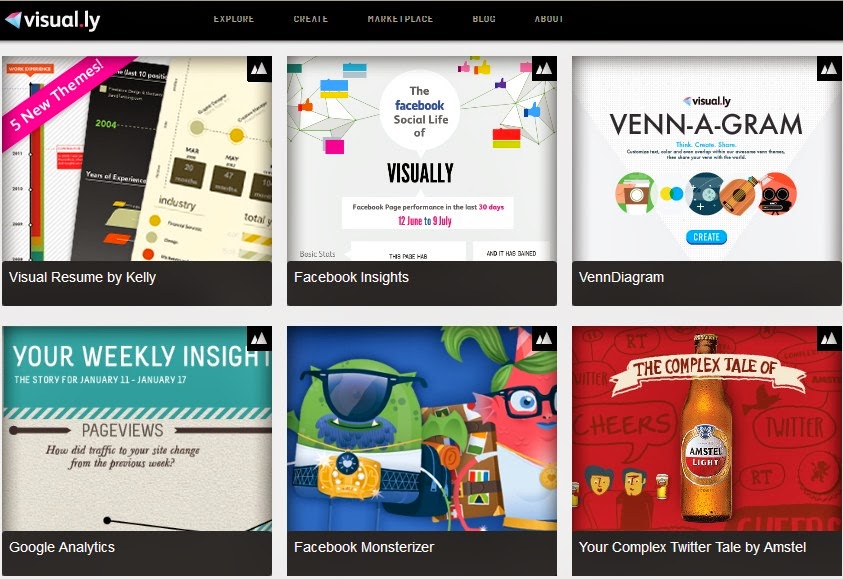
This application you can use it to quickly create customized information map. Very useful tool for the marketers and analysts.
8.Infogr.Am
This tool allows you to quickly create static or interactive information map. You just need to import the data, then you can use this tool to create a variety of functions brilliant charts.
This tool allows you to quickly create static or interactive information map. You just need to import the data, then you can use this tool to create a variety of functions brilliant charts.

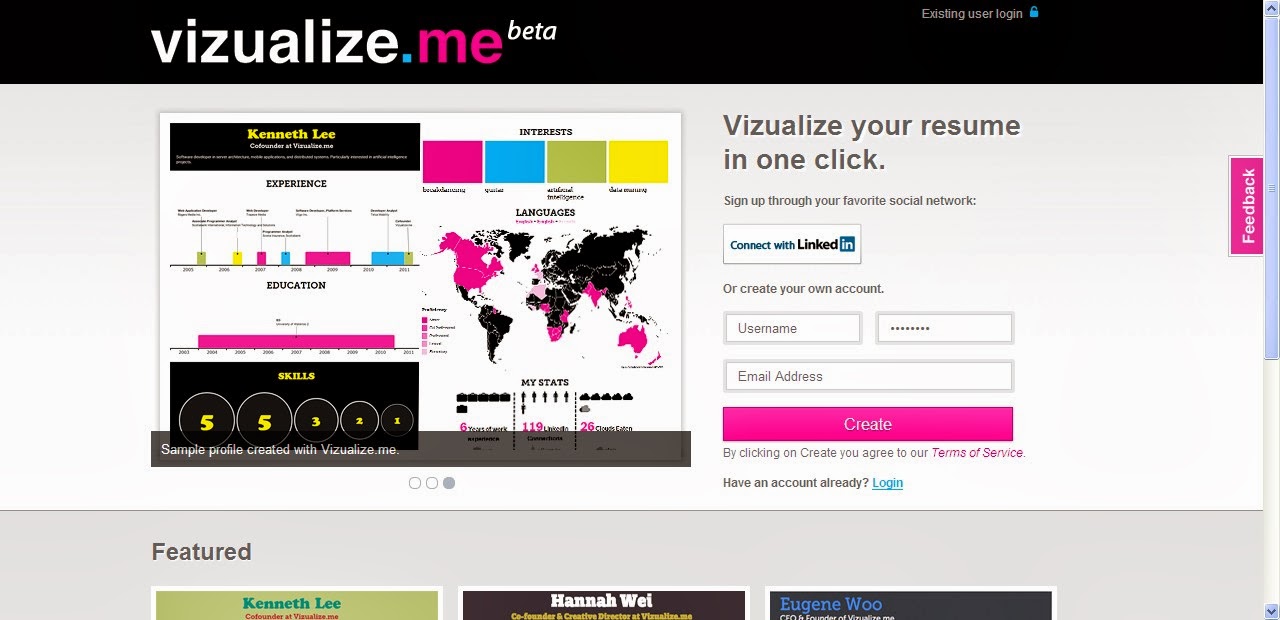
This is a tool used to create a impressive resume. It lets you present a visual representation of the information regarding you and you accomplishments in a simpler yet fun way. This kind of resume will definitely increase the chances of you getting a job! So just a few a few clicks to create an online visual resume, put it on your LinkedIn and wait for the offers.
10.StatSilk
This tool is web-based, offering you a simple analysis of data. It allows you to create great looking maps, tables, graphics and a variety of visual elements to display data. By the Flash templates of Stat Planet you can create a Flash map.
 |
If you have any other suggestions,tools or great ways to create visual communications, please feel free to share!
2013年12月15日星期日
ProcessOn New Features Released
As the toolkit of mockups just released days ago, ProcessOn has new features released today, welcome to check:
1. New interface of the diagram viewing. Take a glance at here: http://www.processon.com/view/507d1e2d0cf21d222759f0b8

2. The button of “Clone” added in “My Diagrams”, use this button to create new diagram based on the exist one in a easier way.

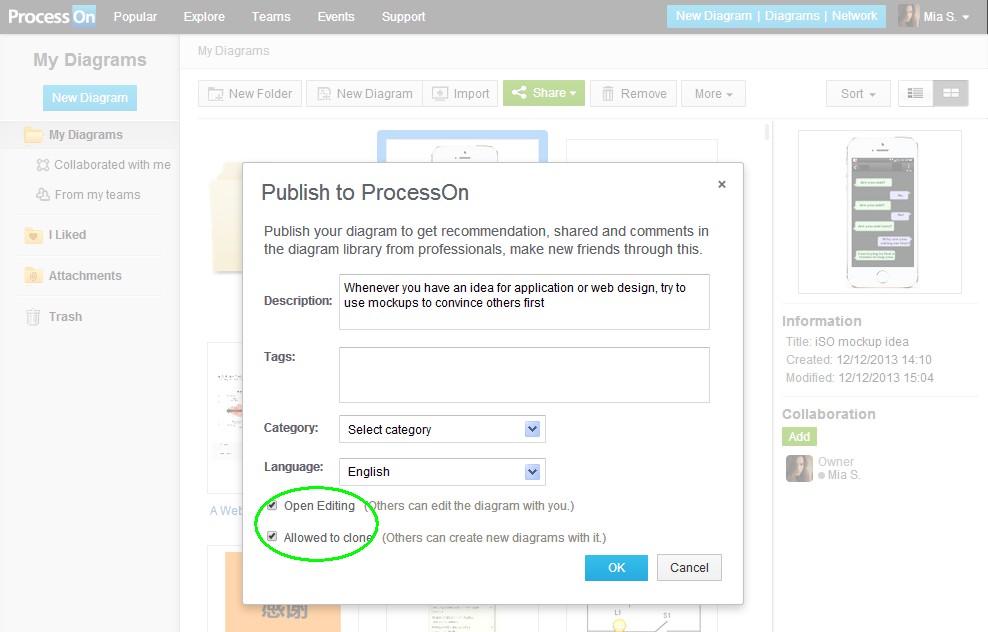
3. Adjustments had been made in the drop menu of “Share” in “My Diagrams”, you can set it as “Open Editing” and “Allowed to clone ” or not.

1. New interface of the diagram viewing. Take a glance at here: http://www.processon.com/view/507d1e2d0cf21d222759f0b8

2. The button of “Clone” added in “My Diagrams”, use this button to create new diagram based on the exist one in a easier way.

3. Adjustments had been made in the drop menu of “Share” in “My Diagrams”, you can set it as “Open Editing” and “Allowed to clone ” or not.
2013年11月4日星期一
2013年10月14日星期一
2013年10月8日星期二
Mind map of Chinese characters,collaborate share diagrams in the classroom
Mind map of Chinese characters,the origin and development of chracters. Contribution for the Chinese learners.Try to create your own diagram about everything,or just use ProcessOn as a collaborate platform with students in the classroom.
2013年9月4日星期三
Create UML Diagram Online for developers
#UML offers a standard way to visualize a system's architectural blueprints.
Web-based tool for developers to create UML diagram(Pic from @Mia S.)

Web-based tool for developers to create UML diagram(Pic from @Mia S.)
订阅:
博文 (Atom)